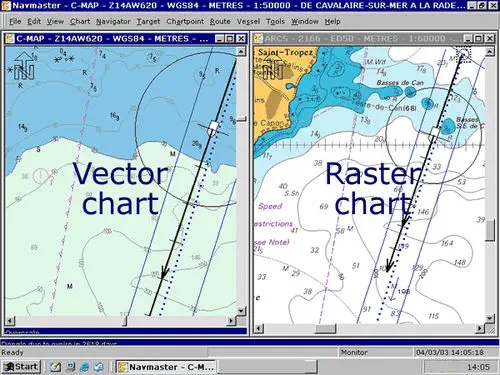
(就在它的正下方,它處理了關於圖形的光柵/矢量差異——在下面進一步查看兩者之間的差異 矢量海圖 (VNC) 和 柵格海圖 (RNC))
當談到矢量圖和光柵圖形之間的差異時,許多人會感到困惑。它相對容易解釋區別,優點和缺點。
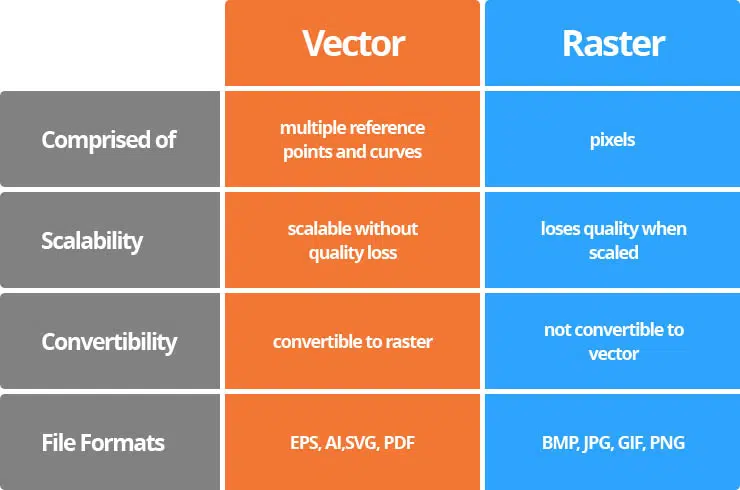
一個 光柵圖像 類似於 像素馬賽克.
每個像素都是一個帶有特定顏色的小方塊,它們以類似馬賽克的圖案組合在一起以生成圖像。每單位的像素越多,分辨率越高。
除非分辨率較低或您放大光柵圖像,否則單個像素通常不可見。
當您放大以隔離單個像素時,您可以使用 Adobe Photoshop 等工具以極高的精度修改照片。只需刪除或修改單個像素的顏色,直到獲得所需的結果。
當顯示陰影和顏色的無縫移動至關重要時,例如在圖像中,光柵圖形是最佳選擇。目錄、傳單、明信片、文具和其他日常項目從光柵圖形中受益匪淺。
即使它們看起來相同,光柵圖像也比矢量圖像佔用更多的硬盤空間。
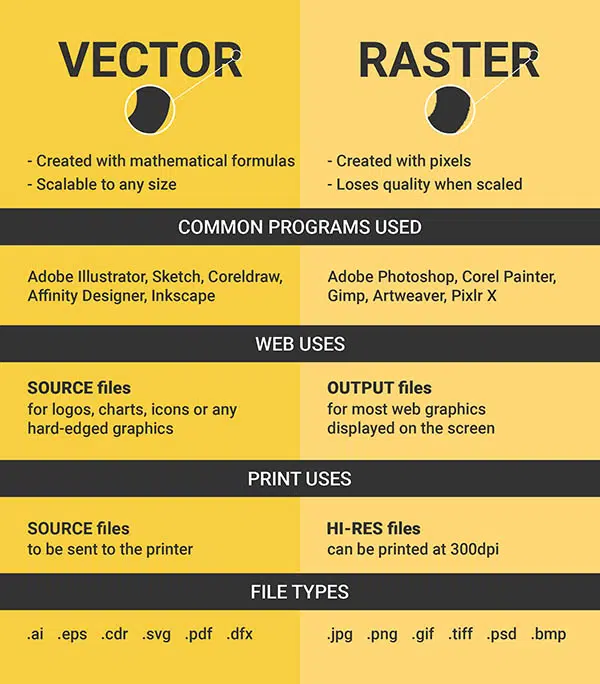
因為光柵文件包含視覺中每個像素的信息,所以情況就是如此。儘管壓縮技術可以幫助解決這個問題,但如果空間是一個問題,這些圖形可能難以處理。 .bmp、.gif、.jpeg、.jpg、.png、.psd 和 .tif 是光柵圖形文件格式的示例。
光柵圖形具有以下優點:它們易於使用、產生精細的顏色漸變,並且易於使用 Photoshop 和 Microsoft Paint 等常用工具進行編輯。光柵圖形的主要缺點是它們並不總是適合生產高質量的印刷品,尤其是當所需的最終產品是一本書時。
中的圖形 矢量格式
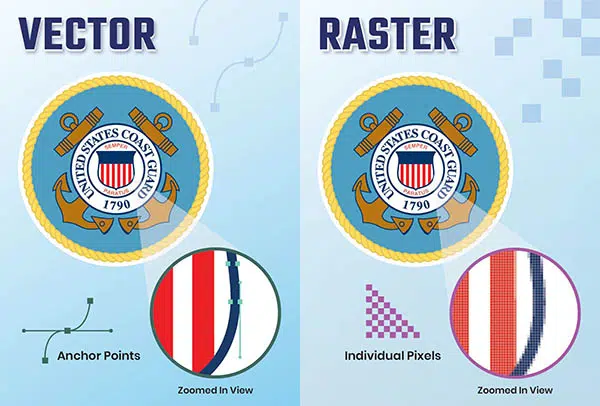
矢量圖形由路徑組成,每個路徑都有一個矢量或數學公式控制其形狀和顏色。控制點之間的曲線可以在矢量圖形中看到,就像在孩子的連點遊戲中一樣。
向量如下。
矢量圖形是可縮放的,因為矢量是用數學定義的。它們可以放大到任何大小,而不會失去清晰度或獲得您在放大光柵圖像時注意到的模糊、像素化特徵。因此,矢量圖非常適合需要各種尺寸清晰度的徽標和其他項目。
最常見的矢量圖形編輯器是 Adobe Illustrator 和 CorelDraw。 .ai、.cdr 和 .eps 是常見矢量文件格式的示例。矢量圖形最常用於印刷小冊子、名片、大型標牌、標誌、窗口圖形和其他項目,包括設計、標誌、符號和/或文本——任何不是圖片或複雜、多需要精細顏色漸變的色調設計。
矢量圖形具有在任何規模上產生最精確和清晰設計的優勢。
另一方面,矢量圖形需要專業的設計工具和使用這些工具的技能。
這 柵格和矢量的優缺點
什麼時候應該使用光柵圖形,什麼時候應該使用矢量圖形?
圖片需要光柵圖像和Adobe Photoshop;信頭、排版、徽標和其他簡單圖形元素需要矢量圖像和 Adobe Illustrator。如果您不確定要使用哪種類型的圖形,請遵循這些準則。
如果您正在處理具有多種顏色的照片,則可以使用光柵圖像。如果您使用有限的顏色繪製任何東西,請選擇矢量圖片。您還可以製作一個包含圖像和徽標或兩種類型圖形的項目。
最後,請記住,您可以輕鬆地將矢量圖形轉換為光柵文件。
但是,它不能雙向工作。在大多數情況下,無法將光柵文件轉換為矢量文件。

如果我不知道我的文件是矢量還是柵格文件怎麼辦?
這似乎是一個荒謬的問題,但事實並非如此。例如,即使文件擴展名表明該項目是矢量圖形,它也可能是在 Illustrator 中打開和保存的光柵圖形。唯一確定的方法是打開文件並仔細檢查設計的一部分。如果您看到矢量編輯節點,您可以判斷它是矢量圖形。
結論
光柵圖像儘管在更大的比例下會失去清晰度,並且文件大小通常難以管理,但它非常適合清晰的圖像,例如表達顏色、陰影和光線微妙漸變的照片。儘管它們無法生成完全無縫的顏色過渡,但矢量圖形非常適合具有較少顏色的可擴展設計。讓您的設計採用兩種格式,或以矢量形式在之後進行轉換,以涵蓋您的所有基礎。


在光柵圖中,整個海圖保存在 一層 – 而在矢量圖中,信息保存在 很多層。
在光柵圖中 定制 是不可能的——而矢量圖可以根據用戶的要求進行設計。
光柵圖是 紙質圖表的直接副本 – 而矢量圖是計算機生成的圖表。
光柵圖出現 雜亂無章 – 而在矢量圖中可以避免混亂。
在光柵圖中 信息只能添加, 而在矢量圖中可以添加和減去信息。
在光柵圖中 審訊 獲取信息是不可能的——在矢量圖中查詢信息是可能的。
在光柵圖中 顯示再生需要時間 – 在矢量圖顯示再生的情況下 是比較快的.
在光柵圖安全深度、輸入 TSS 等中, 報警是不可能的 - 而在向量圖中 可以報警.
在光柵圖中 顏色和符號根據紙質圖表 – 而在 矢量圖符號和顏色 是 根據 IMO 發布指南。 (這 國際海事組織 (IMO) 性能標準要求所有 IMO 批准 電子信息系統 跟著 國際水文組織 (IHO) 顏色和符號規格)
在光柵圖中 圖表比例 不能改變——而在矢量圖中我們可以改變比例。
光柵圖很簡單 更便宜 製作且易於獲得——而矢量圖的製作成本高昂且耗時。
全球覆蓋 在光柵圖表中是可能的——在矢量圖表中,全球覆蓋範圍將 慢慢來。
內存要求 在光柵圖表的情況下更高。
在前瞻/查看期間的光柵圖表中,其他圖表將打開 不同尺度 – 而在矢量圖表中,在前進/審查期間,所有圖表都將採用相同的比例。
光柵圖是一種 單層,沒有信息可以丟失或忽略 – 而在矢量圖中,可能會丟失信息或忽略圖層。
在光柵圖中 無縫圖表是不可能的 – 在矢量圖表中,無縫圖表是一個可能的功能。
為了 永久修正 在柵格海圖中 (RNC) 這 圖表必須更換 – 如果是矢量海圖(VNC) 只要 ENC 數據庫 被糾正。


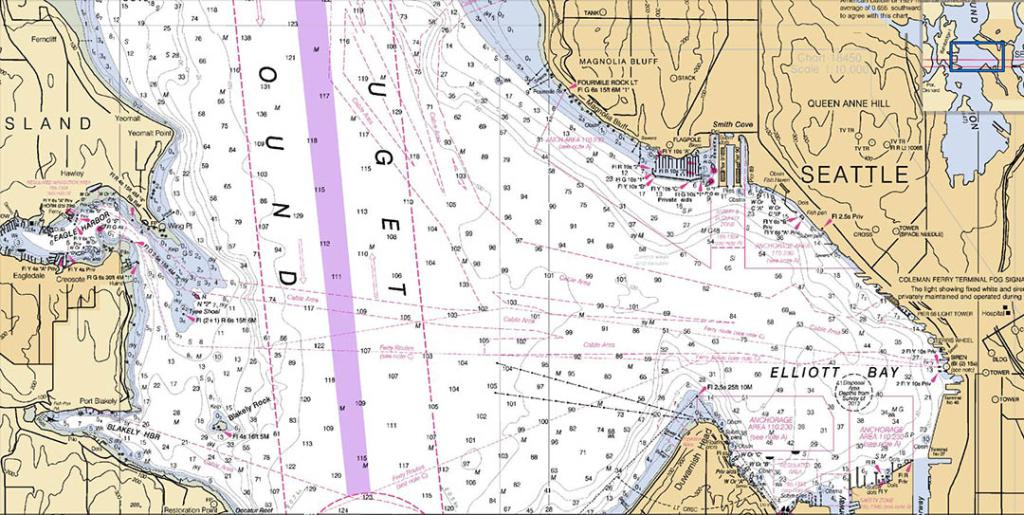
光柵圖基本上是 只是紙質圖表的視覺掃描.它是一個基於計算機的系統,它使用由國家水文局發布或授權的海圖,連同自動連續電子定位,提供綜合導航工具。矢量圖更複雜。看: RCDS 和 ECDIS 之間的差異 (由 IMO – 國際海事組織)
柵格數據 通過掃描紙質圖表生成。此過程生成的圖像是紙質圖表的精確複製品,其中包括由大量彩色點或像素組成的多條線。該技術不能識別單個對象,例如探測,這限制了其符合某些國際準則的能力。然而,使用所謂的矢量疊加,可以顯示指定的用戶數據(例如航點)和系統數據(例如雷達疊加等),可以克服這一缺陷。更多信息請訪問: https://marinegyaan.com/what-are-raster-charts/
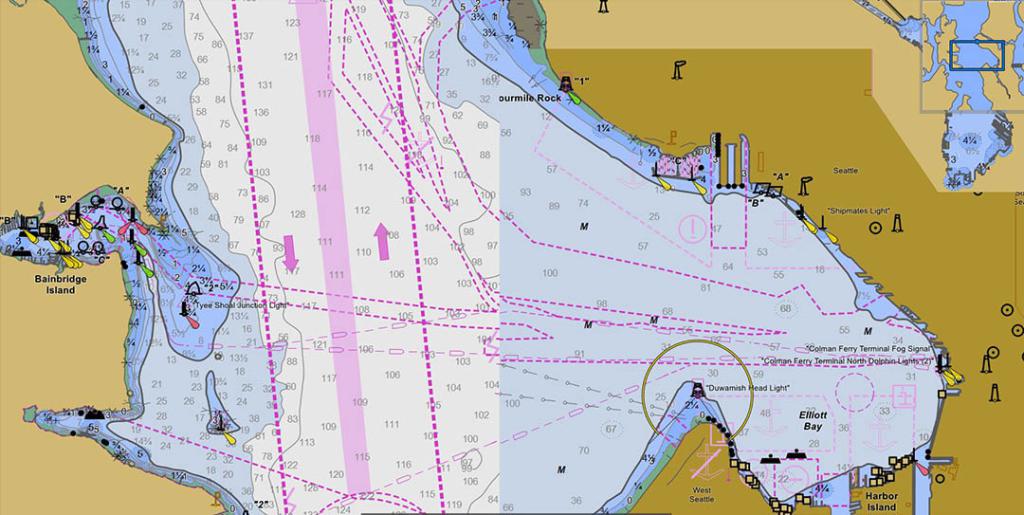
矢量圖是 最常見的電子海圖類型.它們提供了計算機生成的圖表表示,並包含安全導航所需的所有信息(與光柵圖表相比,更多的附加信息)。
加拿大水文服務 (CHS):光柵圖和矢量圖有什麼區別?
導航海圖以光柵導航圖 (RNC) 或矢量電子導航圖 (ENC) 的形式提供數字形式。兩種海圖都使用導航軟件為導航員提供紙質海圖的電子替代方案,從而實現更安全的導航。
RNC 只是紙質海圖的電子圖像。它們通過掃描紙質圖表並將每條線轉換為光柵圖片元素或“像素”來數字化。除了地理參考(定位掃描的圖表,使其以正確的 x 和 y 坐標出現在正確的位置)之外,光柵圖像中沒有智能或額外數據。
ENC 是“智能圖表”,這意味著用戶可以點擊不同的功能,例如燈或浮標,以檢索紙質或光柵圖表中不可用的附加信息。例如,碼頭在 RNC 上僅顯示為圖像,但 ENC 可以將其識別為碼頭並為其附加屬性,例如高度、長度、年齡、所有權、泊位數量等。
ENC 用於電子海圖顯示和信息系統 (ECDIS),並與 GPS 位置、雷達、計劃路線、航向、速度和吃水等其他數據集成,可幫助海員並提醒他們注意航行危險、警告和危險情況。 ENC 是功能強大且靈活的導航工具,可為用戶提供對圖表顯示的更多控制。更多信息請訪問: https://www.charts.gc.ca/charts-cartes/digital-electronique/raster-enc-eng.html
國際海事組織 SOLAS V/19 (SOLAS 代表: 海上人命安全) 概述了船舶需要攜帶的海圖類型的要求:
2.1 所有船舶,不論大小,均應:
2.1.4 海圖 和 航海刊物 計劃和顯示預定航次的船舶路線,並在整個航程中繪製和監控位置。一種電子海圖顯示和信息系統(電子信息系統)亦被接納為符合本分段的航圖運輸規定。第[2.10]款適用的船舶應符合以下運輸要求: 電子信息系統 其中詳述;
2.1.5 滿足第 2.1.4 條功能要求的備用裝置,如果該功能部分或全部通過電子方式實現*;
條例 2.1.4 腳註
*紙質海圖 足以滿足第 .4 條和第 27 條的要求,可用作備用裝置 電子信息系統.其他後備安排 電子信息系統 是可以接受的(見附錄 6 決議 MSC.232 (82), 經修正。)
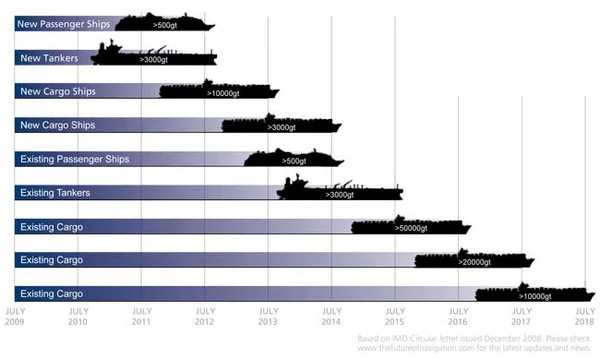
大多數 貨船、油輪、客船和大型遊艇 使用電子海圖顯示和信息系統(ECDIS)。一項修正案 SOLAS 需要這些船隻使用 電子信息系統 作為一個 主要導航方式.經過 2018, 所有這些船隻 將被要求 使用 電子信息系統.的圖表 電子信息系統 授權時間表見下文。
一艘船僅僅擁有一個 電子信息系統 在船上。要符合 SOLAS 並通過港口國檢查 電子信息系統 船上必須包含適合船舶預定航程的電子海圖。有兩種類型的電子海圖 電子信息系統 可以顯示: 光柵導航圖 (RNC) 和 電子海圖 (ENC),也稱為矢量圖。更多信息請訪問: https://www.amnautical.com/blogs/news/17037716-ecdis-vector-charts-raster-charts


